Sample report · Example
What an analysis report looks like
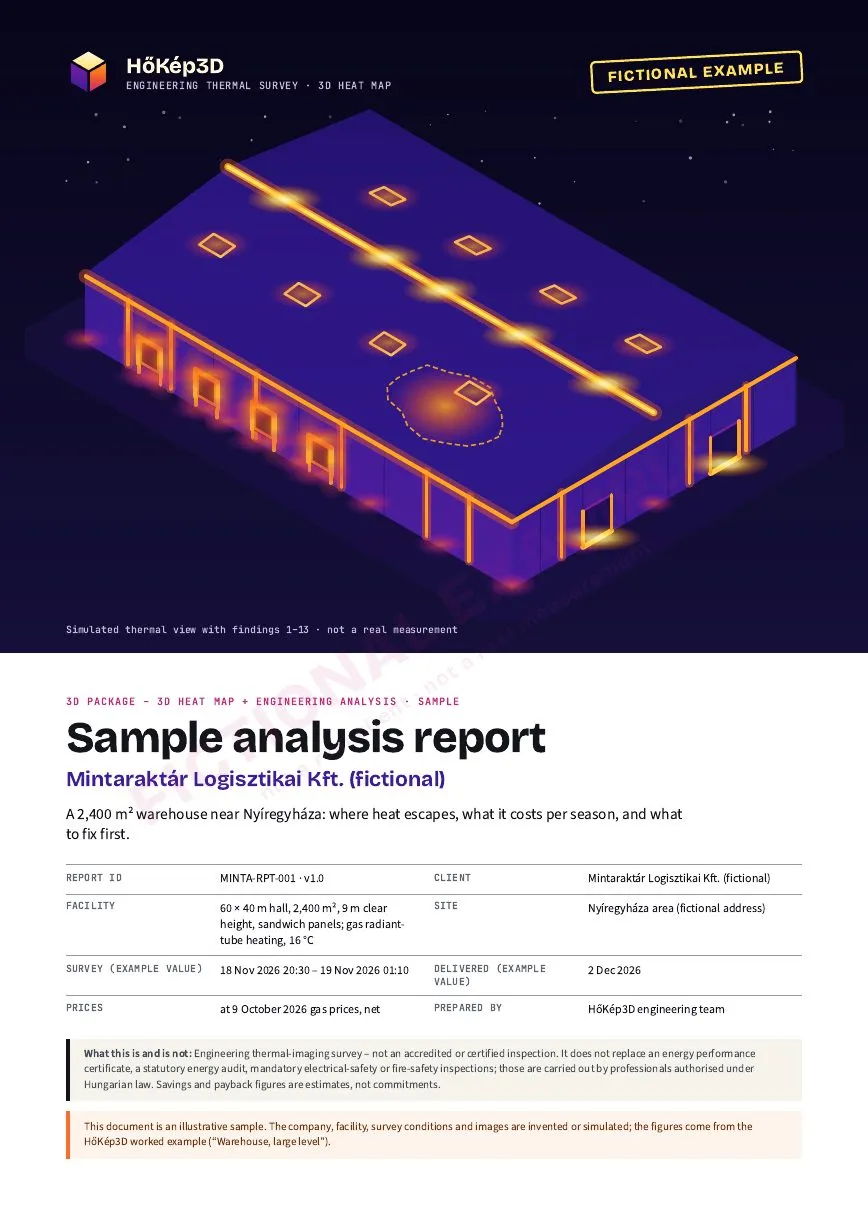
Example Fictional facility, simulated images, invented survey conditions – not a real client. The loss and cost figures come from the HőKép3D worked example (“Warehouse, large level”).
- findings in the sample, with A / B / C priority
- 13
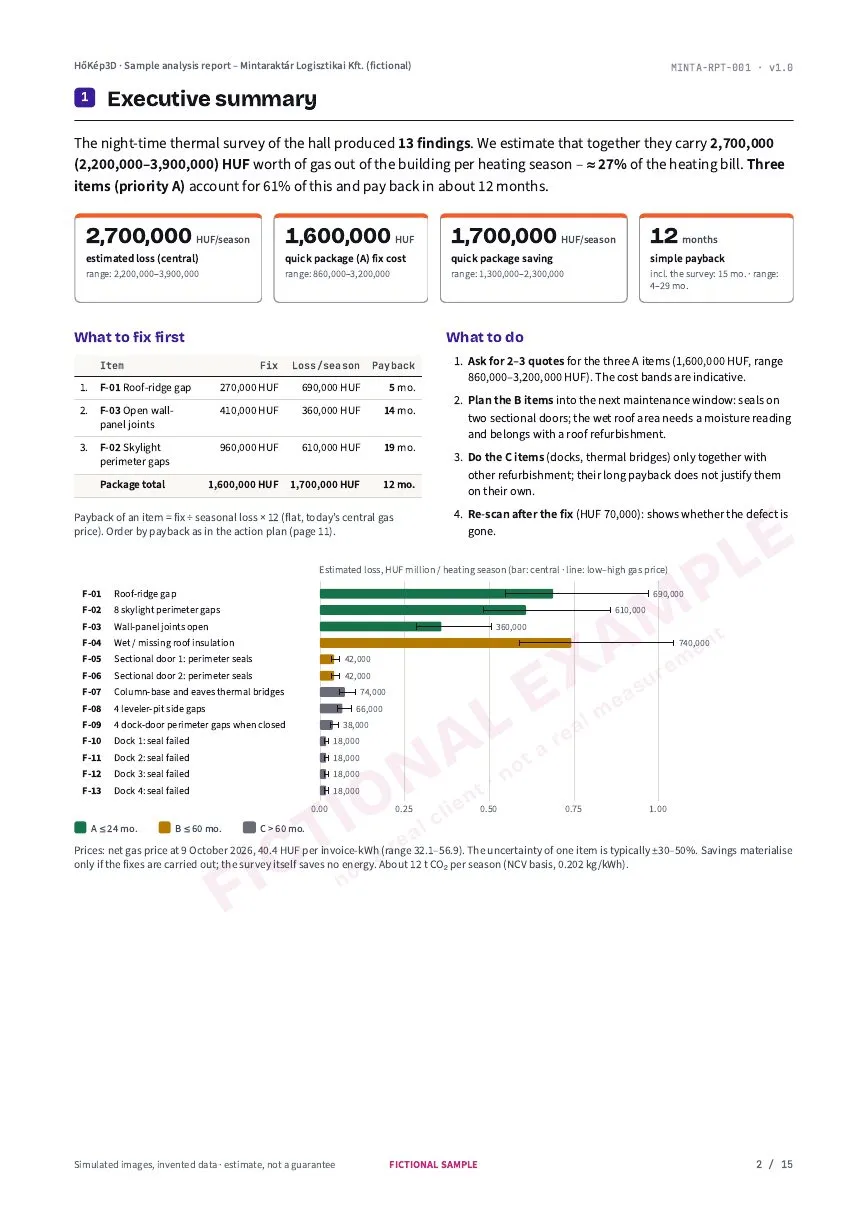
- estimated loss (HUF 2.2–3.9 M), at October 2026 gas prices
- 2.7 HUF M/season
- quick package fix ≈ HUF 1.6 M (0.9–3.2 M)
- 3 A items
- simple payback of the quick package (4–34 months)
- 12 months
Estimate – not a guarantee. Figures are model-based and actual values may differ.
01 / Contents
What is in a real report?
The product is the analysis, not the pictures: every finding comes with an exact location, an image pair, a likely cause, an estimated loss and a fix suggestion. The sample runs to 15 pages.
-
01
Executive summary
One page: top findings, HUF per season central and range, quick package, payback, what to do first.
-
02
Survey conditions
Temperature difference, wind, sun, heating – the validity criteria and that night’s values.
-
03
Method and limits
What a thermal camera can and cannot do; how a thermogram becomes forints; why ±30–50%.
-
04
3D overview
Numbered findings on the hall’s 3D model; the delivered package includes an interactive 3D heat map.
-
05
Finding cards
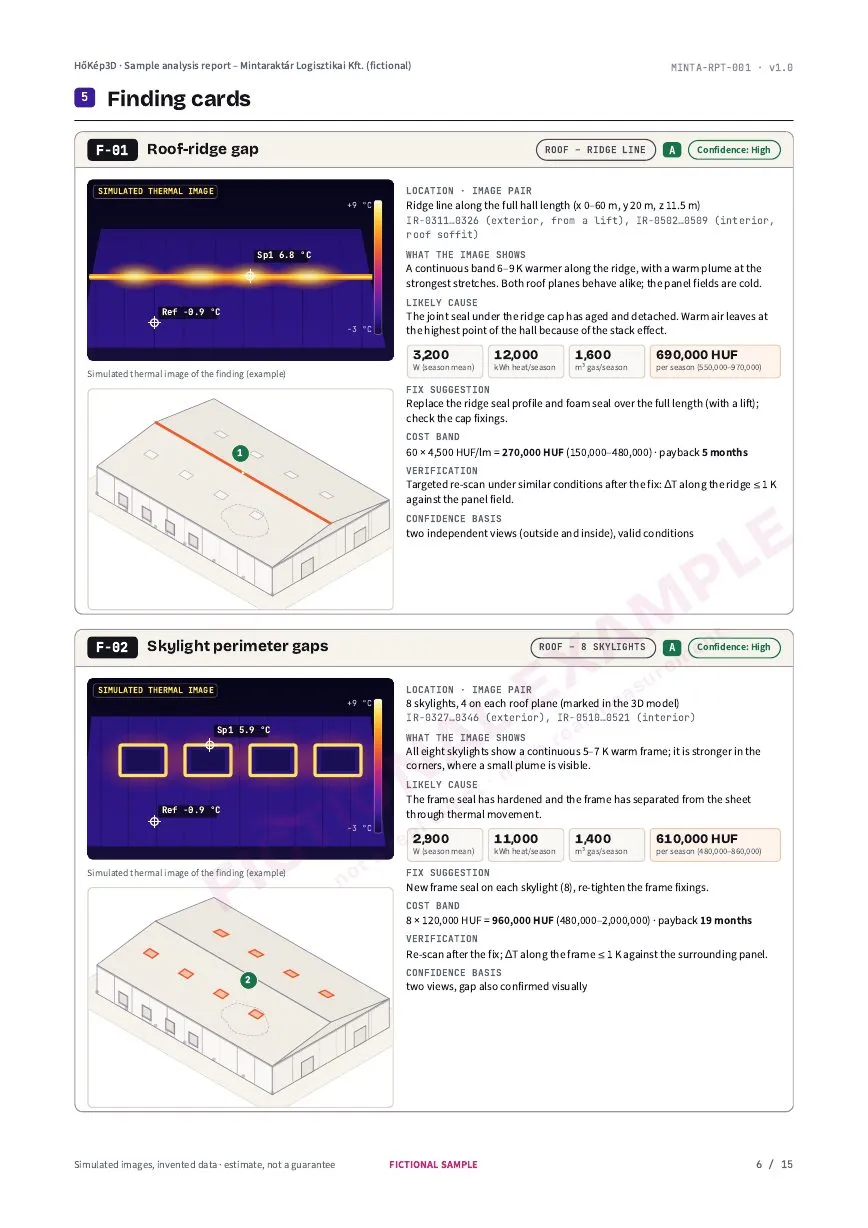
For each: location, thermal image and diagram, cause, W / kWh / m³ / HUF with range, fix, cost band, priority, payback, confidence.
-
06
Action plan
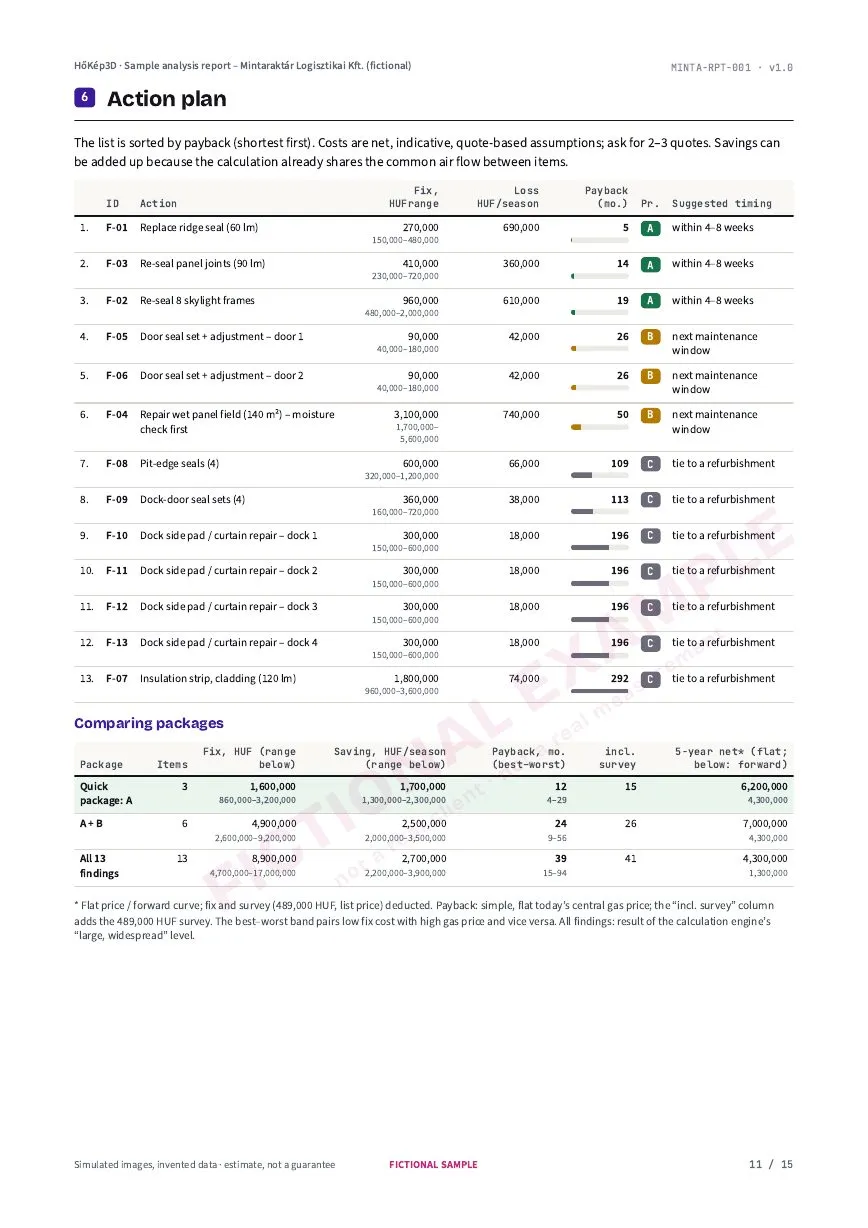
A list sorted by payback, and the quick package compared with the full list.
-
07
Five years, two scenarios
Flat today’s gas price and the forward curve; the survey price included.
-
08
Assumptions and price basis
Gas price with date and range, weather, efficiency, fix unit prices – nothing hidden.
-
09
Data package and approval
Files with an SHA-256 manifest; field thermographer and approving engineer roles, glossary, legal limits.
02 / Preview
Four pages from the sample
The images are taken from the downloadable PDF; click one and the full document opens at that page.
03 / Finding card
One card – six questions, one answer
-
Where is it?
Measured in the 3D model (x, y, z), with image-pair IDs: a contractor finds it in minutes.
-
Why is it there?
The likely cause and the exclusion of alternatives (reflection, solar, process heat).
-
What does it cost?
W, kWh, m³ gas and HUF/season – at low, central and high gas price, with a date.
-
What do we fix?
A fix suggestion with an indicative cost band; a verification step after the fix.
-
When does it pay off?
A / B / C priority (24 / 60 months) and simple payback.
-
How sure are we?
Confidence: High, Medium, Low – with the reasoning.
04 / Downloads
Downloads
Every PDF is free, no registration. In the sample and in the case studies every party and data point is fictional or simulated.
Case studies (examples)
05 / Honestly
What this sample is – and is not
The real report is delivered within 10 working days of the survey, as a PDF with an interactive 3D heat map, an editable action list and raw files. More on the method on the Method page, and on the numbers behind it in the worked examples. More examples: family house, cable connection, buried pipe (all: case studies).
Get the same for your own hall
We survey at night, register the images on a 3D model and rank what to fix first. We reply by the next working day at the latest.