Case study 03 · Example

Buried pipe – large heat leak (example)

A wetted pre-insulated hot-water line under the paving reveals nothing from the surface – on a thermal image it shows as a warm band about 25 metres long. The example shows what a thermal camera can do, and what it cannot.

Example Example – illustration built from open-licensed images and simulated data, not a real client.

loss on the 25 m wet section (200 W/m, range 100–380 W/m)
5.0 kW
Estimate
heat loss in one heating season (at a 50 l/h leak)
≈ 48,000 kWh
Estimate
cost per heating season (HUF 1,200,000–2,900,000)
2,100,000 HUF
Estimate
payback of the repair (6–61 months)
17 months
Estimate

01 / Starting point

The make-up meter says it leaks – but where?

A pre-insulated (PUR) hot-water line runs under a paved area between two buildings at a 80 °C supply temperature. The make-up water meter shows more top-up water than expected, but the location is unknown: the line runs under paving and nothing shows at the surface.

The leak is downstream of the heat meter, so the lost heat is billed one to one. Wet insulation also multiplies the heat emission – the worked example applies this to the wet section.

Pipe
pre-insulated (PUR) hot-water line between two buildings
Supply temperature
80 °C
Wetted section
25 m
Leak (main variant)
50 l/h (two other variants below)
Operating hours
5,342 h/heating season

02 / Measurement

How we would measure

A surface thermogram shows the temperature of the ground surface – the pipe’s heat is seen through the soil. That is why conditions matter.

  1. Step 1: Timing

    At night or before dawn, without sun, on dry surfaces, in calm and preferably cool weather: that way sunshine and wind do not mask the thermal contrast.

  2. Step 2: Top-down survey

    We cover the route by drone (where airspace and permits allow) or with a handheld camera and stitch the images into a top-down heat map.

  3. Step 3: Matching the route

    If there is a drawing, we overlay it on the thermal image; a thermogram can hint at the route but does not replace marking out the route on site (e.g. with a pipe locator).

  4. Step 4: Documenting

    Temperature profile of the background, an intact stretch and the suspect stretch, a visual photo, the surface material (paving, grass) – because emissivity differs by material.

Good conditions

  • night or before dawn, several hours after sunshine
  • dry paving and ground
  • calm air
  • a large temperature difference between the pipe and the background

Poor conditions

  • surfaces warmed by the sun
  • rain, wet or waterlogged surfaces
  • strong wind
  • thick snow or ice: it insulates and hides the surface temperature (a melt pattern can, however, be a clue in itself)

03 / Finding · thermal image

The surface tells nothing – the thermogram does

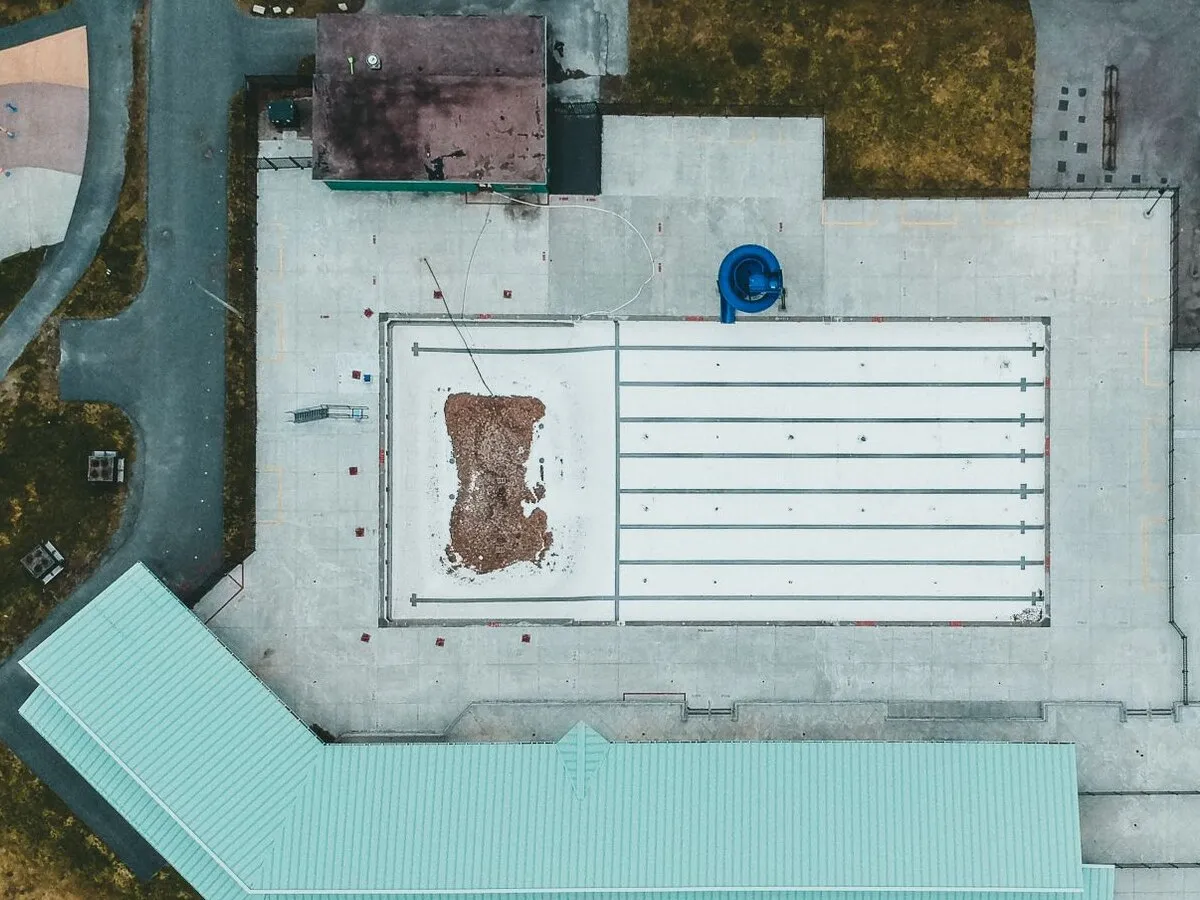
Drag the slider: the simulated night-time thermal image on the left, the drone photo on the right. The blue dashed line is the route; the white section line (A – A′) marks the profile below.

Drag the slider between the simulated thermal image and the drone photo. Hover the thermal side with a mouse, or tap it on a touch screen, to read the simulated surface temperature.
Top-down drone photo and a simulated night-time thermal image of the same area. The heat layer is our own calculation, built from the photo’s brightness and an invented pipe model. Not to scale; the route and the leak are invented. Photo: Jonathan Cooper (The Shutter Vision) / Pexels, Pexels License – cropped; the heat layer is our own simulation

03 / Finding · cross-section

Cross-section: intact line and wetted section

Simulated surface temperature profile across the pipe Background about 3 °C. Above an intact pre-insulated pipe the surface is barely warmer (about 4.2 °C); above the wetted section the peak is about 15.8 °C, about 0.6 m from the pipe axis. Simulation. 0 6 12 18 -6 -4 -2 0 +2 +4 +6 Surface temperature, °C (simulated) Distance from the pipe axis, m (section A – A′) Wetted section: peak ≈ 15.8 °C (≈ +12.8 K above background) above the wetted section above an intact pipe (≈ +1.2 K) background ≈ 3 °C paving soil pre-insulated pipe pair wetted soil and insulation
The simulated profile: above an intact line the surface is barely warmer than its surroundings; above the wetted section the anomaly is wider and far stronger, and the moisture spreads sideways. The drawing is illustrative and not to scale.

With intact insulation the surface above the line is barely warmer than its surroundings – which is why a thermal camera often hardly sees an intact pre-insulated line. Above the wetted section the anomaly is wider and far stronger.

Moisture spreads sideways and along the pipe in the trench, so the warm patch is larger than the defect itself. This is why a thermogram marks out a stretch, not a point.

The contrast here is simulated. On real images it can be smaller; it depends on depth, paving and soil.

03 / Finding · 3D cut-away

Below the surface: a 3D ground cut-away

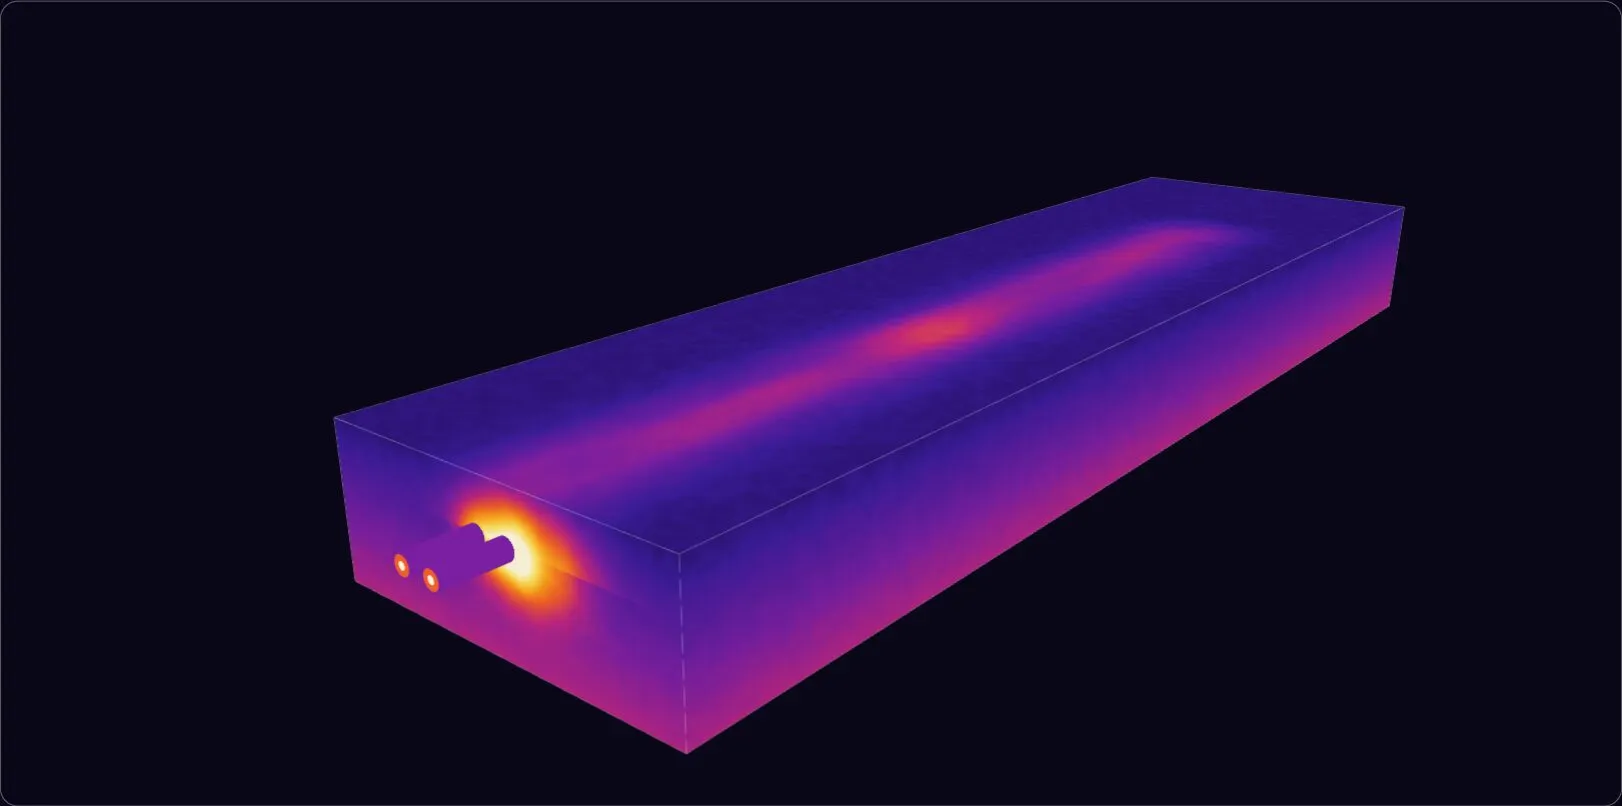
A simulation: on the cut face the wet zone spreads around the pipe and towards the surface. Switch between thermal and visual and look at the cross-section.

Simulated 3D ground cut-away: two pre-insulated pipes below the paving with a wetted section of about 25 metres, above which the surface is warmer too. Rotatable view.
Simulation – illustration

Rotatable, with temperature read-out

Drag to rotate. Hover a surface with a mouse, or tap it on a touch screen, to read the ground layer and its simulated temperature. Simulated ground cut-away: a surface thermogram shows only the surface temperature – not the pipe depth and not the leak location. The geometry is simplified and the temperatures are invented.

03 / Finding · real images

What it looks like in reality

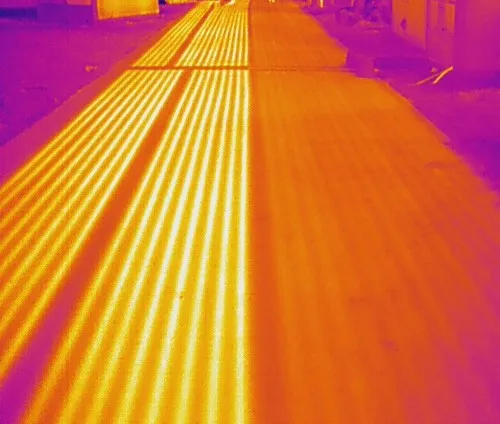
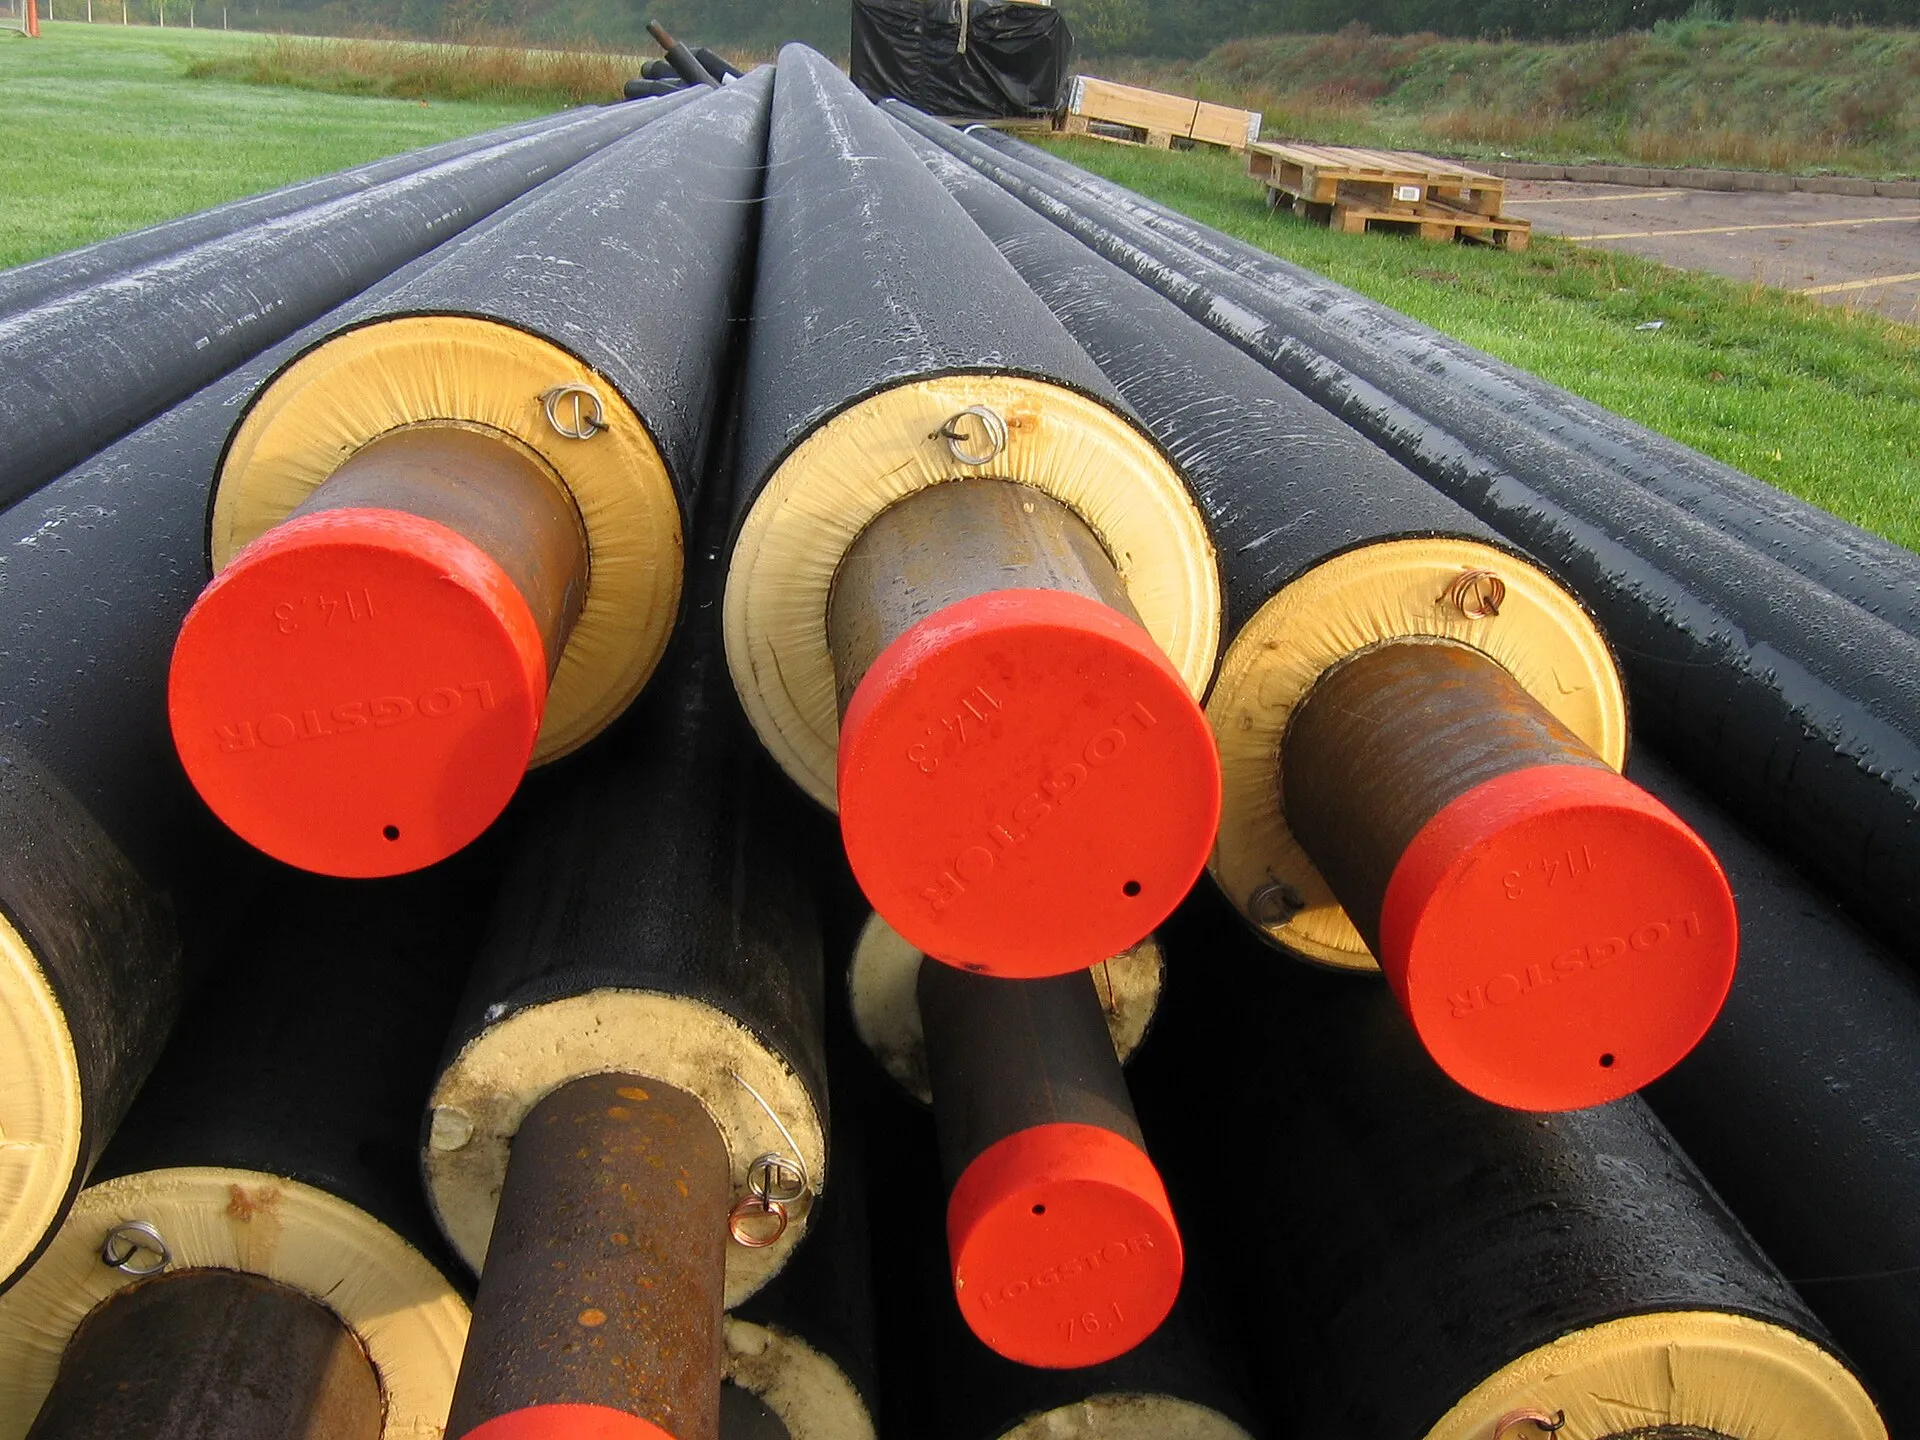
Real, open-licensed images. We did not modify them. Other sites, other conditions – they are not comparable with our example; they only show the phenomenon.

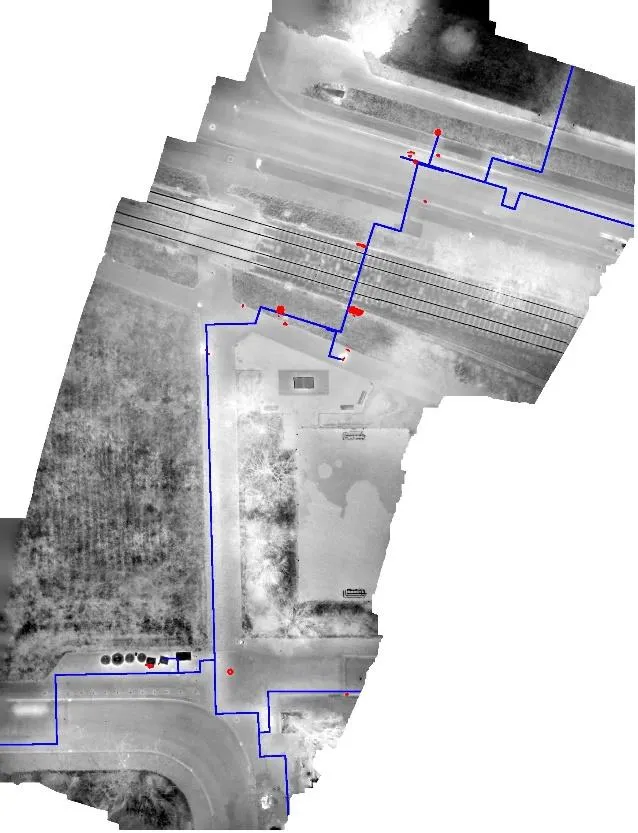
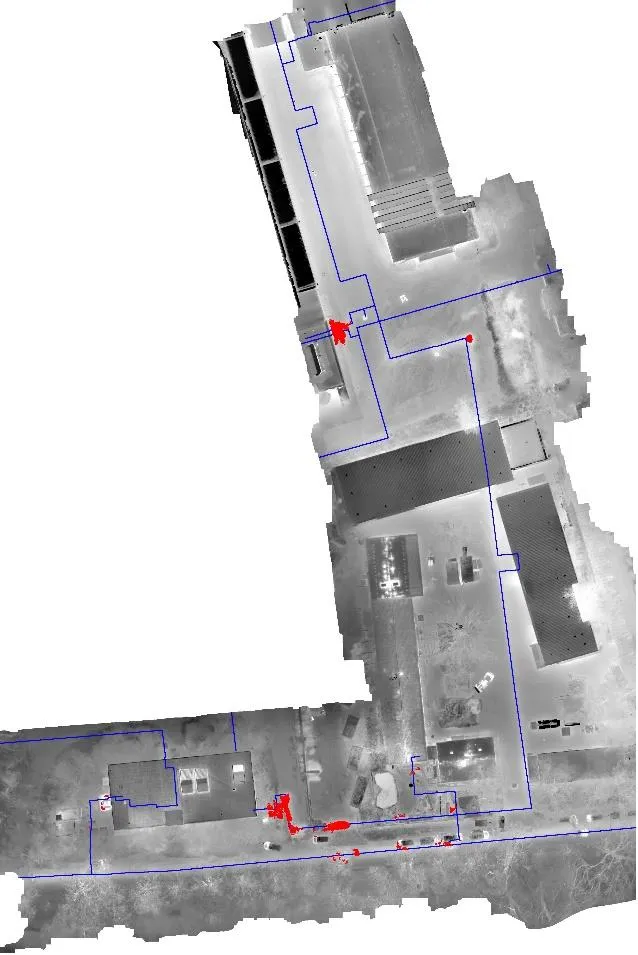
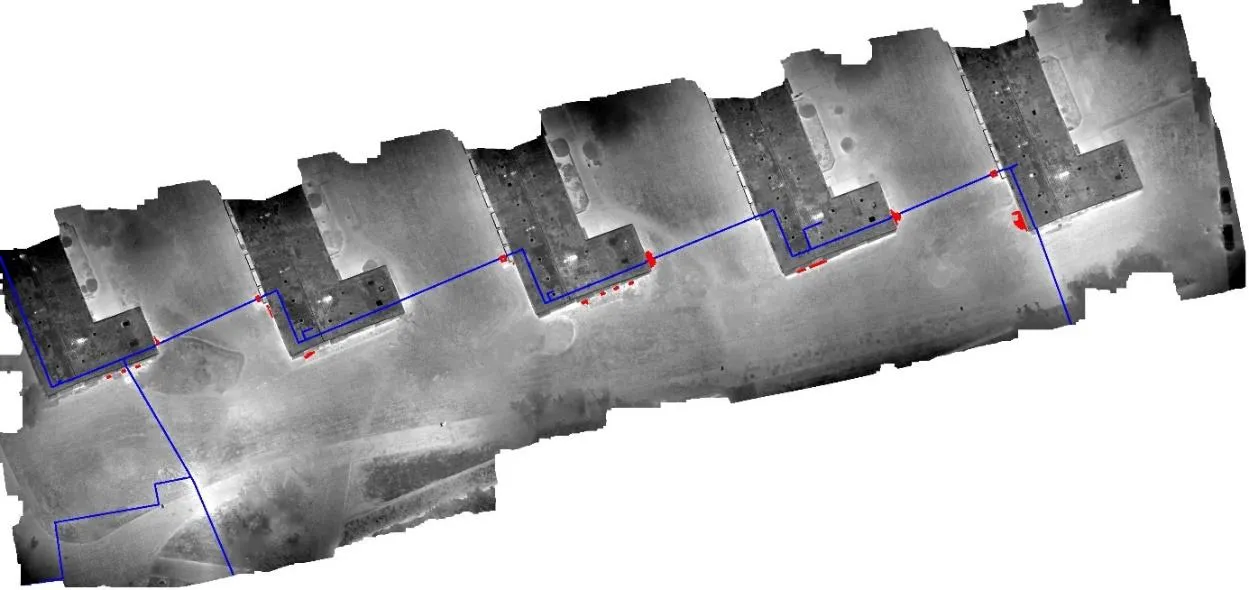
UAV thermal orthophotos of district-heating networks (ISPRS, 2020)

Researchers at Leibniz University Hannover flew UAV infrared orthophotos over district-heating networks. In the grayscale images warmer points are brighter; the blue line is the network route from GIS, and the red blobs are thermal anomalies flagged by the authors’ algorithm – possible leaks. Real survey data, but with algorithmic markings and without a temperature scale. A thermal anomaly alone does not prove a leak: it needs verification.

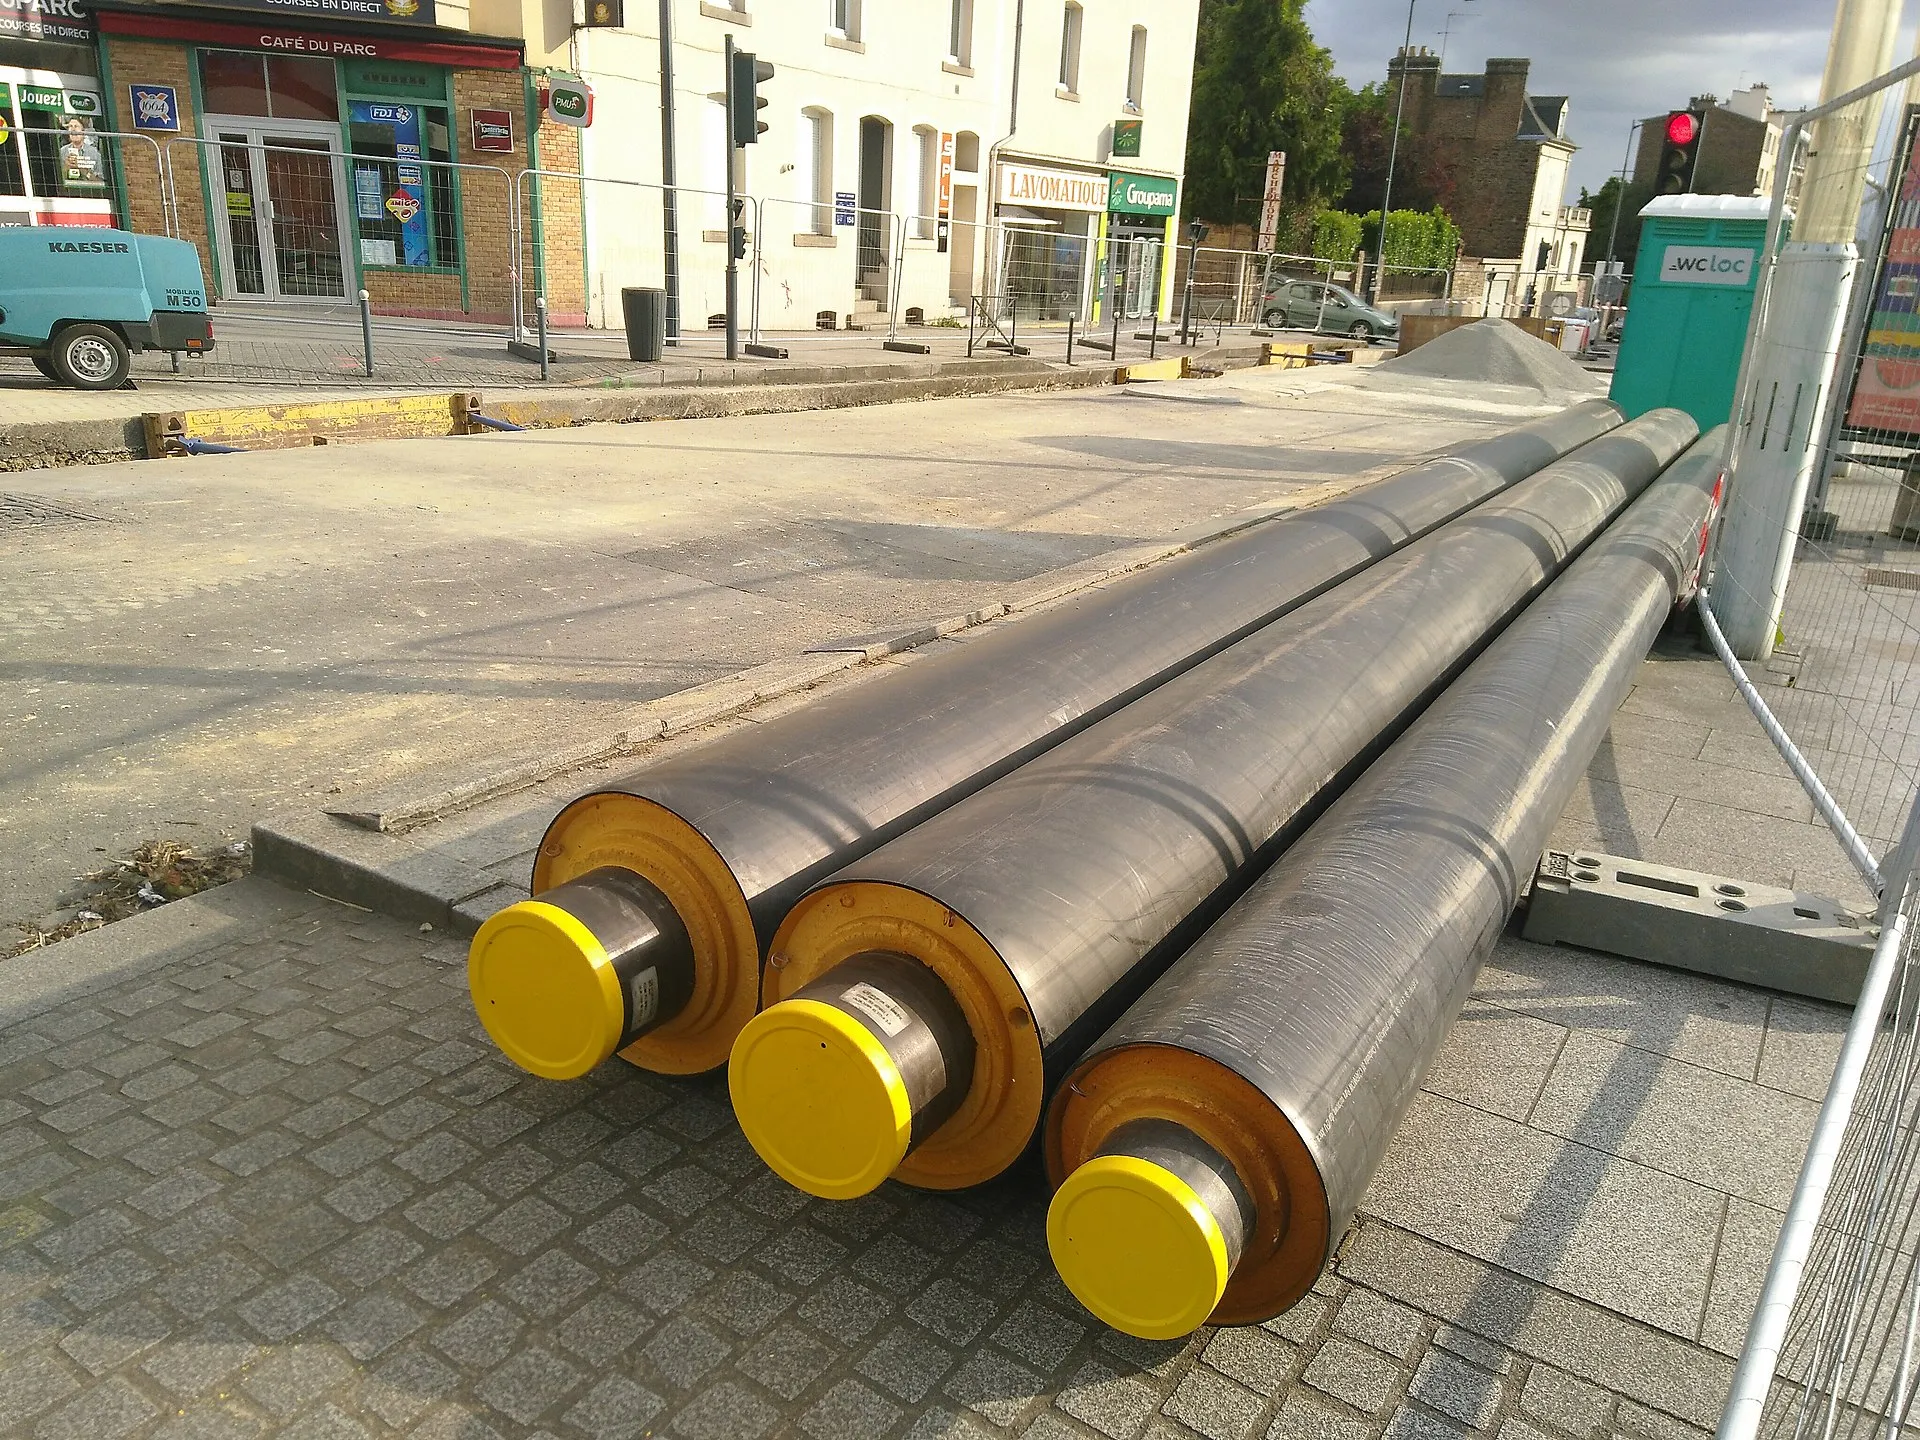
Three pre-insulated steel pipes with yellow end caps on a paved street during district-heating works
Image: Abujoy, Wikimedia Commons, CC BY 4.0 – resized

What lies under the paving

Three pre-insulated pipes on a street during construction. In operation all of this runs below the paving – the camera sees only the effect that reaches the surface.

04 / Engineering assessment

In numbers: from W/m to forints

The main variant of the example: a 25 m wetted section, a 50 l/h leak, one heating season (5,342 hours). Every value is an estimate, rounded.

  1. Conduction loss

    200 W/m · 25 m = 5.0 kW

    × 5,342 h ≈ 27,000 kWh per season. A Ljubljana district-heating study measured 200–380 W/m on wetted insulated lines; the calculation uses 200 W/m (central) with a 100–380 W/m range, the lower bound being an assumption.

  2. Make-up water

    50 l/h · 5,342 h = 267 m³

    Heating it: 1.163 kWh/(m³·K) · 70 K ≈ 81 kWh/m³, i.e. ≈ 22,000 kWh per season. The make-up water itself costs ≈ HUF 400,000.

  3. Total

    ≈ 48,000 kWh · HUF 2,100,000 (HUF 1,200,000–2,900,000)/season

    Rounding differences are possible. The leak is downstream of the heat meter, so the loss is billed one to one. The heat price is a proxy based on a non-residential district-heat tariff (the local tariff may differ), the make-up water price is an assumption; October 2026 prices.

Three leak variants for one heating season (25 m wet section, 200 W/m)
LeakMake-up waterHeating the make-upCost, central (range)Repair payback5-year net
5 l/h27 m³2,200 kWhHUF 1,100,000 (HUF 590,000–1,400,000)33 moHUF 2,400,000
50 l/h267 m³22,000 kWhHUF 2,100,000 (HUF 1,200,000–2,900,000)17 moHUF 7,700,000
500 l/h2,671 m³220,000 kWhHUF 13,000,000 (HUF 7,000,000–18,000,000)3 moHUF 61,000,000

Estimate, not a guarantee. The conduction loss is the same in all three variants (≈ 27,000 kWh). With year-round operation (8,760 h) the 50 l/h variant costs HUF 3,500,000 (HUF 1,900,000–4,800,000) and pays back in 10 months. Net of VAT; the repair costs HUF 3,000,000 (HUF 1,500,000–6,000,000) in all three cases.

In a large district-heating network a closed-circuit water balance is only reliable above about 4 m³/h (Ljubljana study), so leaks of this size hide at network level. On a smaller private system the make-up water meter is the first check; the thermal camera is for locating the leak, not for detecting it.

05 / Recommended action

From thermogram to repair

  1. Step 1: Water balance

    Read the make-up water meter and check the closed circuit: this confirms that a leak really exists.

  2. Step 2: Confirm the location

    The thermogram marks out a stretch. The location of the fault has to be confirmed by acoustic leak detection, tracer gas or a trial excavation – carried out by your contractor.

  3. Step 3: Repair

    Excavating, repairing or replacing the wet section, restoring insulation and paving. The worked example assumes a repair cost of HUF 1.5–6 million, central HUF 3 million.

  4. Step 4: Re-scan

    After the repair we re-scan under similar conditions: the thermogram shows whether the warm band is gone.

06 / What it means in money

Payback – and the worst case

Financial overview (50 l/h, heating season, net of VAT)
ItemCentralRange
Loss per heating seasonHUF 2,100,0001,200,000–2,900,000 HUF
RepairHUF 3,000,0001,500,000–6,000,000 HUF
Pipe-run survey (minimum price)HUF 90,000–
Payback of the repair17 months6–61 months
5-year net result of the repair (flat prices)HUF 7,700,000−130,000 – 13,000,000 HUF

Estimate, not a guarantee. The survey price is the pipe-run minimum: HUF 60,000 per started 500 m, at least HUF 90,000; for buried runs the result is indicative. Survey and repair together also pay back in about 17 months (central case).

The worst case

The bottom of the range is not “zero”: under unfavourable assumptions (low loss, high repair cost) the repair does not pay back within five years – the calculation ends about HUF 130,000 short. The numbers materialise only if the fault is found and actually fixed.

07 / Limits

What a thermal camera cannot do

  • No depth. Surface temperature does not tell how deep the pipe runs.
  • No leak location. Moisture spreads in the trench; the warm patch is larger than the defect. The location must be confirmed by acoustic detection, tracer gas or trial excavation.
  • False alarms. Other warm lines (domestic hot water, sewers), surfaces warmed by the sun or different paving emissivity can also create contrast.
  • Missed leaks. With deep burial, thick paving, rain, snow or ice, a real leak may not show.
  • Simulation. The thermal image and the 3D cut-away are simulations with invented temperatures; on real images the contrast can be smaller.
  • We do not repair. We provide the survey, the heat map, the analysis and a recommendation; excavation and repair are done by your contractor.

Image credits, licences and sources

This example consists only of open-licensed photographs, our own simulation and the data of the worked calculation example. CC BY-SA images are shown unmodified (only scaled for the web).

Our own work

  • The simulated heat layer, the cross-section chart and the 3D ground cut-away are our own work; the temperatures are invented.
  • Source of the numbers: HőKép3D worked calculation example “D” (buried pipe leak), 9 October 2026, rounded to two significant figures.

Data sources

Full list of image sources and licences

Request a quote to survey your buried pipe

Briefly tell us where the line runs and what points to a leak (e.g. make-up water use) – we reply by the next working day at the latest.