Case study 02 · Example

Hall interior heat map – overheating cable connection (example)

A loose terminal dissipates a few watts – yet it reads 78 °C on a thermogram. This example shows what an early warning is good for, and what it is not.

Example Example – illustration built from open-licensed images and simulated data, not a real client.

the loose terminal on the simulated thermogram (hall air ≈ 28 °C)
78 °C
Example
extra loss in the terminal (160 A, +0.5 mΩ)
12.8 W
Estimate
value of the wasted energy (HUF 4,000–5,900)
≈ 5,100 HUF/yr
Estimate
terminal re-torque + checks (HUF 25,000–90,000)
45,000 HUF
Estimate

01 / Starting point

It runs, and nothing looks wrong

A small production hall runs one or two shifts: a press, a conveyor, a compressor. The machines are fed from a row of switchgear cabinets along the back wall. One feeder carries 160 A per phase for about 3,000 hours a year (assumption).

Nothing looks wrong: no trips, no smell, everything runs. Maintenance is in next year’s plan. The question is whether the row contains a connection that still works but is already getting hot – and if so, where.

Load
160 A per phase (assumption)
Hours at this load
≈ 3,000 h/yr (assumption)
The fault
+0.5 mΩ contact resistance on one phase
Hall air
≈ 28 °C (simulated)

02 / Measurement

How we would measure

Electrical thermography only makes sense under load: without load there is no heating, so no fault shows.

  1. Step 1: Planning

    We agree which cabinets are covered, when normal operating load is present and which authorised electrician will open the covers.

  2. Step 2: Measuring under load

    We measure during normal operation from a safe distance. Your authorised electrician opens the covers; we never touch live parts.

  3. Step 3: Documenting

    Per cabinet: a thermogram and an ordinary photo of the same view, load current and operating state, ambient temperature, the emissivity setting.

  4. Step 4: Assessment

    ΔT against similar components and against ambient, A/B/C priority, recommendation. If we find a deviation we say so on site instead of waiting for the report.

03 / Heat map

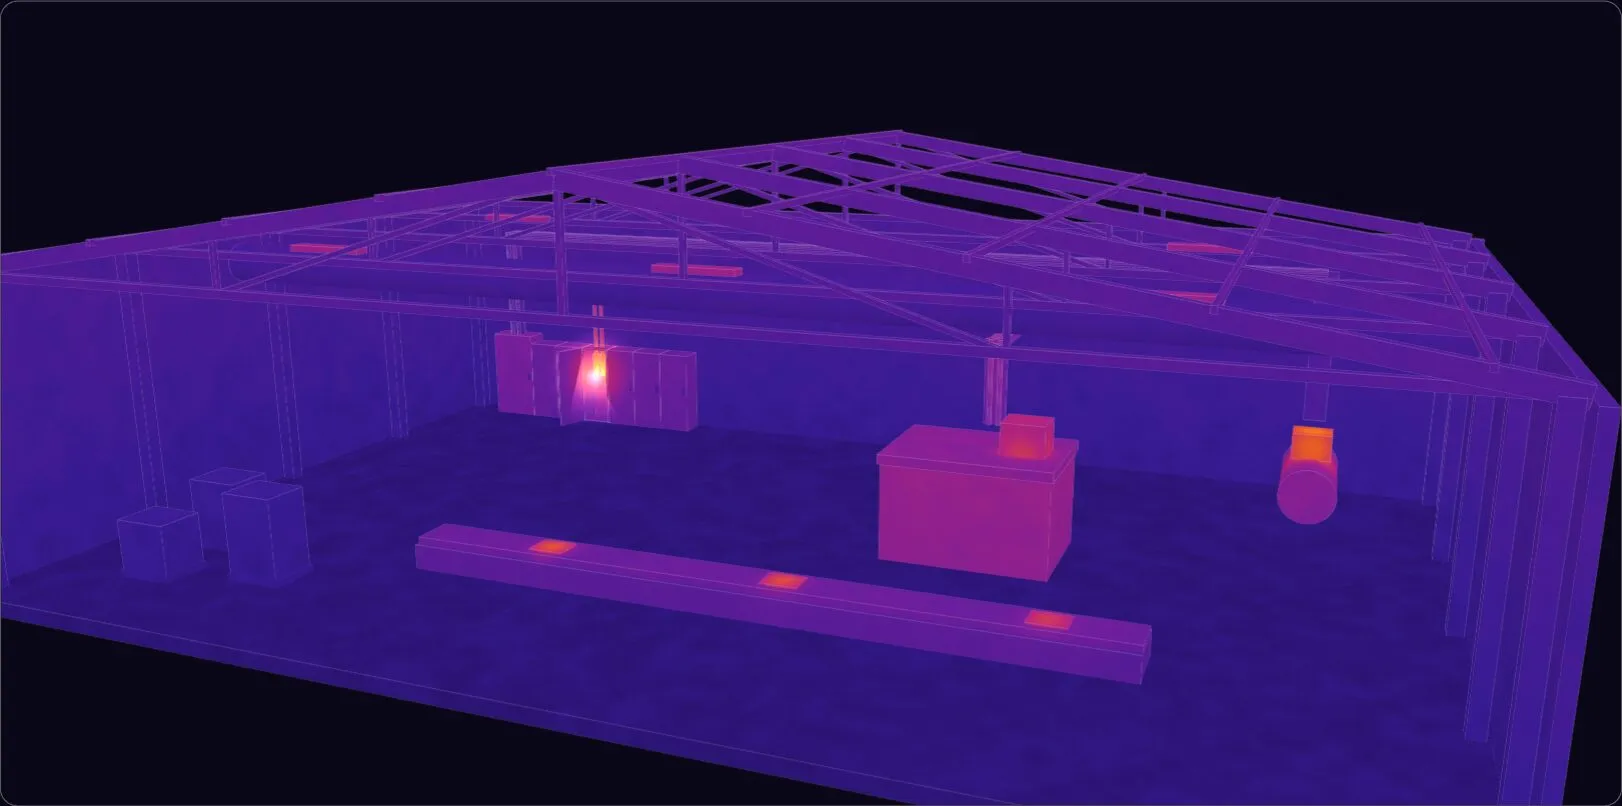
The heat map: one hot terminal in the hall

A simulation: the geometry is simplified and the temperatures are invented. Rotate the view, switch between thermal, visual and findings, and hover a surface for its temperature.

Simulated 3D thermal map of a small production hall: a loose terminal in one switchgear cabinet reads 78 °C against about 28 °C ambient. Rotatable view.
Simulation – illustration

Rotatable, with temperature read-out

Drag to rotate. Hover a surface with a mouse, or tap it on a touch screen, to read its simulated surface temperature. Interior of a small production hall – simulated heat map. The geometry is our own simplified model; the temperatures are invented.

04 / Finding

What it looks like in reality

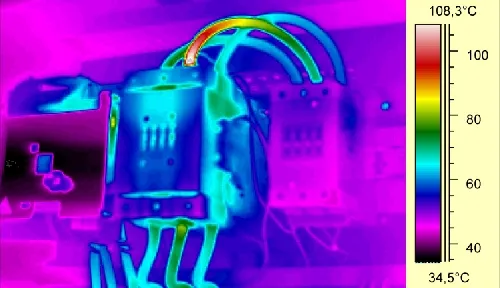
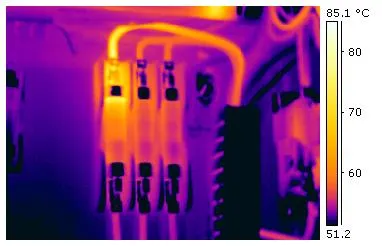
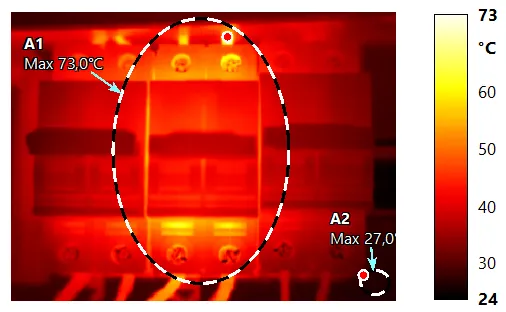
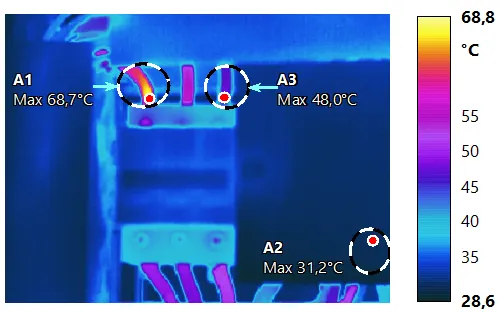
Real, open-licensed thermograms of loose or overloaded electrical connections. The images are unmodified; the temperatures come from each image’s own scale and markers. They were taken with different cameras under different conditions, so they are not comparable with one another.

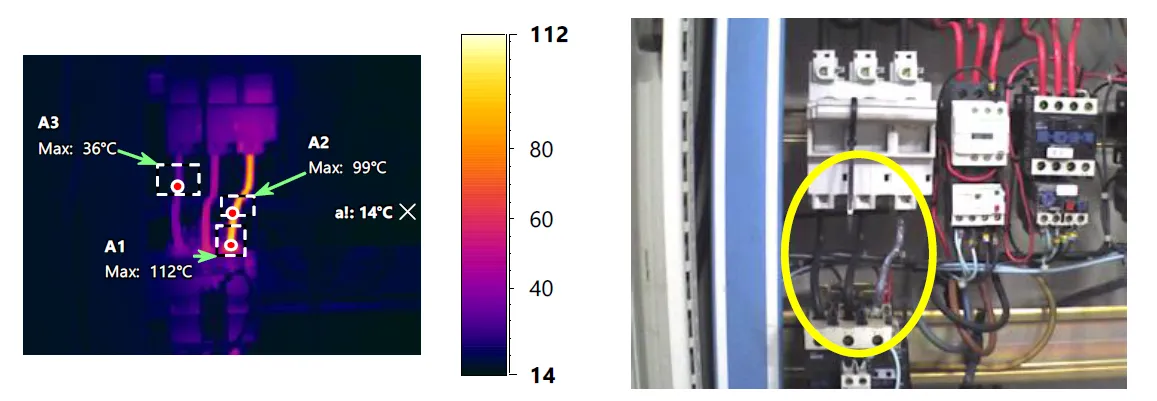
Thermogram of an electrical cabinet (left) and an ordinary photo of the same cabinet (right); the yellow ellipse marks the faulty fuse-holder connection, a 112 °C spot on the thermogram
Image: Contrôles-électriques, “Défaut de connexion porte fusibles thermographie infrarouge”, Wikimedia Commons, CC BY-SA 4.0 – unmodified

Fuse-holder connection fault – thermogram and photo of the same cabinet

A clear illustration of how a report is built: the visual photo sits next to the thermogram and the marker shows which component it is. Two spots around the faulty connection read 99–112 °C, while the third marker (A3) reads 36 °C.

A1 (hottest spot)
112 °C
A2
99 °C
A3 (reference)
36 °C
Ambient (as marked in the image)
14 °C
A1 − A3
76 K

How we read it: ΔT, not absolute temperature

Three ways to read a thermogram
ComparisonAgainst whatWhy it helpsWatch out for
ΔT vs a similar componentThe neighbour with the same load and type – e.g. the terminals of the other two phasesLoad and ambient largely cancel out; in practice the strongest indicatorIf all three phases are equally faulty there is no good reference
ΔT vs ambientThe cabinet or hall air temperatureA simple, easily understood numberLoad-dependent: at a lower current the fault looks smaller
Absolute temperatureThe limit allowed by the component manufacturerA temperature above the limit is a problem in itselfApparent temperature also depends on surface emissivity and reflections

In the illustrative example the loose terminal is +38 K above the neighbouring phase terminal and about +50 K above the hall air.

Our report gives A/B/C priorities: for an A item we tell you on site and the fix should not wait for the next maintenance; B goes into the next planned maintenance window; C means watch and re-scan. The band limit is not a single threshold but the combination of load, the manufacturer’s limit and the ΔT against similar components. ΔT-based classifications are common practice, but guidelines and manufacturers give different limits – so the report always names the basis of the decision.

05 / Engineering assessment

In numbers: little energy, real risk

Two separate questions: how much energy does the faulty connection waste, and how large is the risk. The first can be calculated; the second cannot be priced.

P = n · I² · Rextra = 1 · (160 A)² · 0.5 mΩ = 12.8 W

Losses of the faulty terminal (worked example, 160 A, +0.5 mΩ, 3,000 h/yr)
CasePowerEnergyCost, central (range)Local rise (illustrative)
One phase12.8 W38 kWh/yrHUF 5,100/yr (HUF 4,000–5,900)13–51 K
All three phases38.4 W115 kWh/yrHUF 15,000/yr (HUF 12,000–18,000)38–154 K

Estimate, not a guarantee. Net of VAT. Local rise = P · R_th with R_th = 1–4 K/W: an illustration, not a measurement.

Why does 12.8 W show on a thermogram? Because the heat is generated in a contact area of a few square centimetres and can hardly escape. At a thermal resistance of 1–4 K/W, 12.8 W means roughly 13–51 K of local rise. The simulated finding (about +50 K above hall air) sits at the top of that range – an advanced state. The heating may also speed up oxidation of the contact surface, so the fault can feed itself.

The wasted energy is worth a few thousand forints a year, so it is not the point. The point is that the terminal can get worse with time – and that a thermogram shows it before the consequences do.

06 / Recommended action

What the operator should do

Priority A the loose terminal · Priority B the cable run

  1. Step 1: Flag on site

    We report the A item to your electrician on the day of the measurement – it does not wait for the report.

  2. Step 2: Fix by an authorised electrician

    An authorised electrician isolates the circuit, inspects the terminal, re-torques or replaces it, and checks the neighbouring terminals and the cable insulation.

  3. Step 3: Check the cable run

    The moderate warming along the cable leaving the terminal is also a reason to check the cable’s load rating and bundling (priority B).

  4. Step 4: Re-scan under load

    After the fix we measure the same point at a comparable load again: the thermogram shows whether the ΔT is gone.

07 / What it means in money

A tiny item – and energy is not the stake

Indicative costs (net of VAT)
ItemAmount, central (range)
Wasted energy (one phase)HUF 5,100/yr (HUF 4,000–5,900)
Terminal re-torque + checksHUF 45,000 (HUF 25,000–90,000)
Replace terminal / contactorHUF 120,000 (HUF 60,000–250,000)
Thermographic cabinet screeningHUF 12,000 per cabinet with a package; stand-alone HUF 18,000 per cabinet, minimum HUF 60,000

Estimate, not a guarantee. Repair costs are indicative, quotation-based assumptions; the actual price depends on the local contractor.

What we do not put a price on

The real stake is failure, downtime and fire risk. We deliberately do not put a monetary figure on it: we have no reliable source for downtime cost and will not invent a number.

One sourced fact: of 736 fires investigated in Hungary in 2022, 73 (9.9%) had electrical energy as the cause. It is the national disaster-management (OKF) sample, all building types together – there is no breakdown for business premises. Source (OKF, PDF)

The point

An early warning, not a savings project.

A fault of a dozen watts shows on a thermogram at once – to the eye or to a breaker it does not yet. The fix is small next to the consequences – but we cannot say what the consequences are worth, and we promise no savings.

08 / Limits

What this example does not claim

  • Surface only. The camera sees surface temperature; what is behind a cover or panel stays hidden. We do not open cabinets ourselves.
  • No load, no heating. At idle a bad connection can look normal; at low load the fault is underestimated.
  • Bare metal is a poor emitter. Shiny copper and aluminium have low emissivity and reflect, so the apparent temperature can be lower than the real one. We use references, but the uncertainty remains.
  • One moment in time. A fault can develop after the measurement; a thermogram describes that moment only.
  • Simulation. The 3D view is a simplified model with invented temperatures; the real images were taken with other cameras at other sites.

Image credits, licences and sources

This example consists only of open-licensed photographs, our own simulation and the data of the worked calculation example. CC BY-SA images are shown unmodified (only scaled for the web).

Our own work

  • The hall’s 3D model: our own simplified, procedurally generated geometry (three.js); the temperature field is a simulation.
  • Source of the numbers: HőKép3D worked calculation example “E” (electrical hot spot), 9 October 2026, rounded to two significant figures.

Data sources

Full list of image sources and licences

Request a quote to screen your electrical cabinets

Available as a quick diagnosis or as part of a larger survey. Briefly tell us how many cabinets are involved – we reply by the next working day at the latest.