Family house 3D heat map (example)
Simulated thermal texture on a 3D house model shows typical defects: lintel thermal bridge, roller-shutter box, slab edge, roof eaves. It shows what a 3D heat map looks like.
Case studies
Example Example – illustration built from open-licensed images and simulated data, not a real client.
01 / Why examples?
A starting service has no list of references yet – and there is no need to pretend otherwise. The three examples show what you get from a real survey: what a 3D heat map looks like, how we read a finding, and how it becomes a monetary figure, a recommendation and a priority.
Every example carries the “Example – illustration” label, the source and licence of each image, and numbers come with ranges and assumptions. Simulated thermal images show invented temperatures; the real open-licensed images come from other sites and are always marked.
Real cases will appear here once the client has consented in writing and the data has been anonymised. The 2026/27 heating-season pilot offer (limited to the first 10 facilities) exists partly so that such cases can come about. Pricing and pilot offer
02 / The three examples
All illustrations. Click a card for details: interactive 3D view, real thermograms, figures in forints.
Simulated thermal texture on a 3D house model shows typical defects: lintel thermal bridge, roller-shutter box, slab edge, roof eaves. It shows what a 3D heat map looks like.
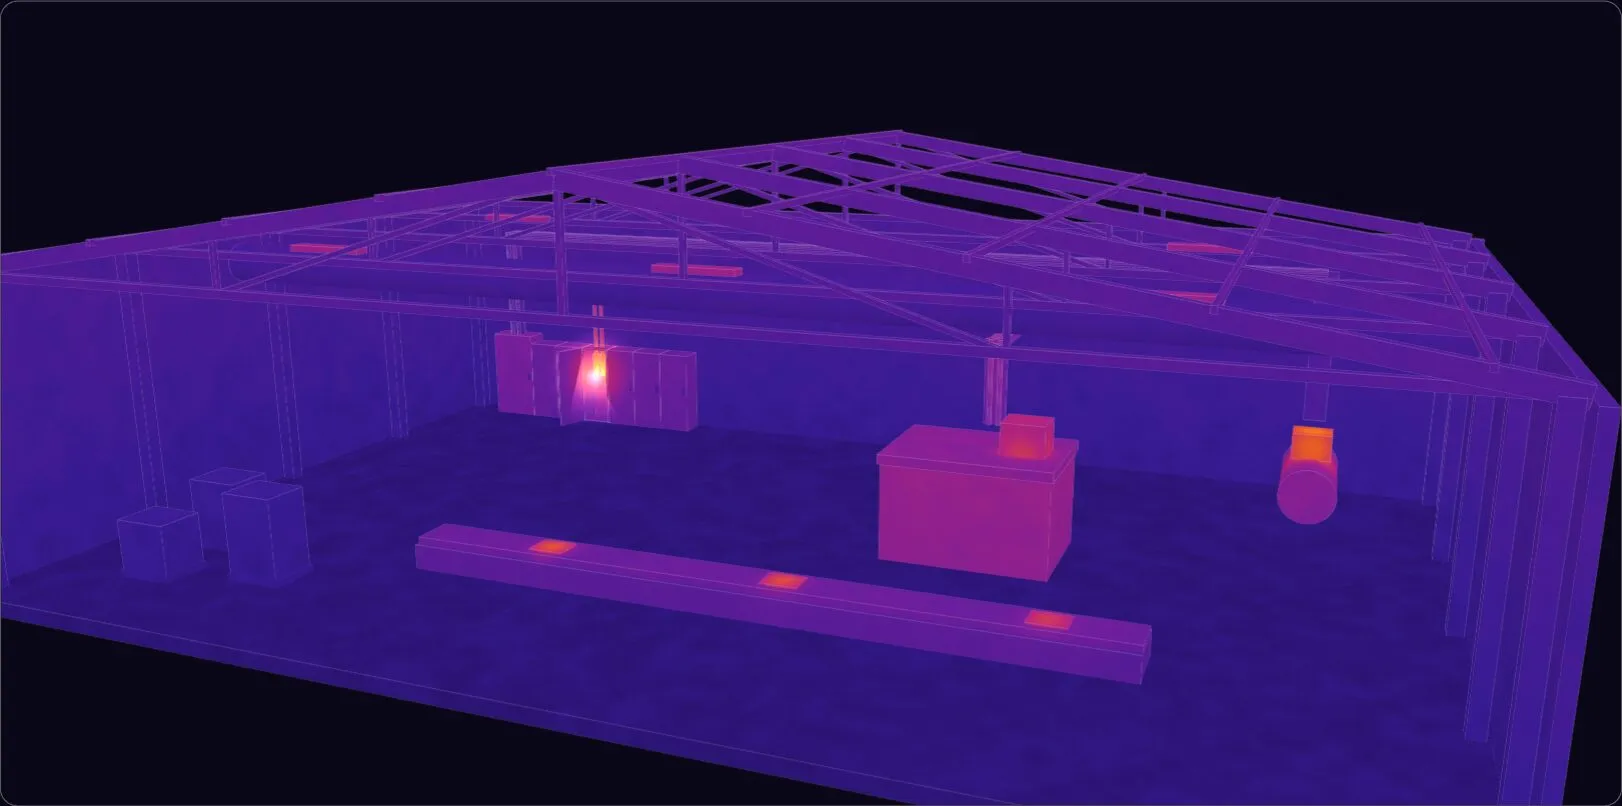
A loose terminal dissipates a few watts, yet it reads 78 °C. An early warning: the fix is small, the consequence large – but this is not the mandatory electrical inspection.
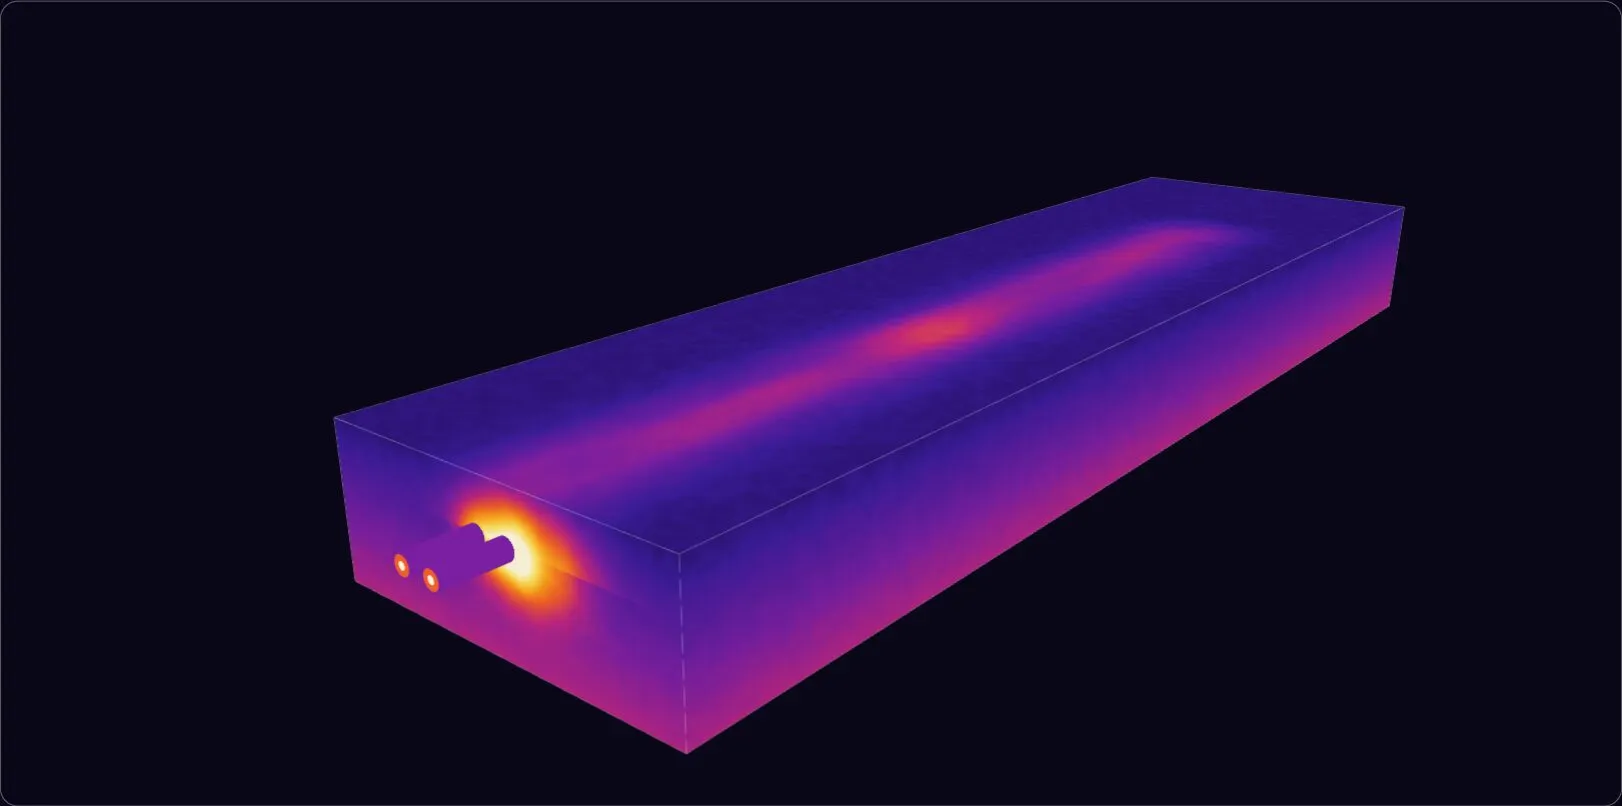
A wetted pre-insulated pipe under paving is invisible from the surface – on a thermal image it is a warm band about 25 m long. W/m, kWh, forints and payback.
03 / What a real client receives
The examples follow the real structure, with sample data. After a real survey – with a 10-working-day delivery – you receive this.
Executive summary, findings with a photo pair (thermal + visual), likely cause, estimated loss in W, kWh and forints with a range.
A browser link: a rotatable model, findings in place, temperature read-outs.
XLSX/PDF: recommended fix with an indicative cost band, A/B/C priority, payback.
The original thermal images and photos so your own specialists can use them.
We go through the findings, answer questions and set the order together.
The delivery time is 10 working days. If the survey conditions are not suitable we reschedule free of charge.
Sample report · Worked examples · How we measure · Image sources and licences
Briefly describe what you want surveyed – we reply by the next working day at the latest. An engineering thermal-imaging survey is not an accredited or certified inspection.